
A collection of diagrams describe the base system as we collectively understand it. We navigate these through metadata annotations collected with a web tool.
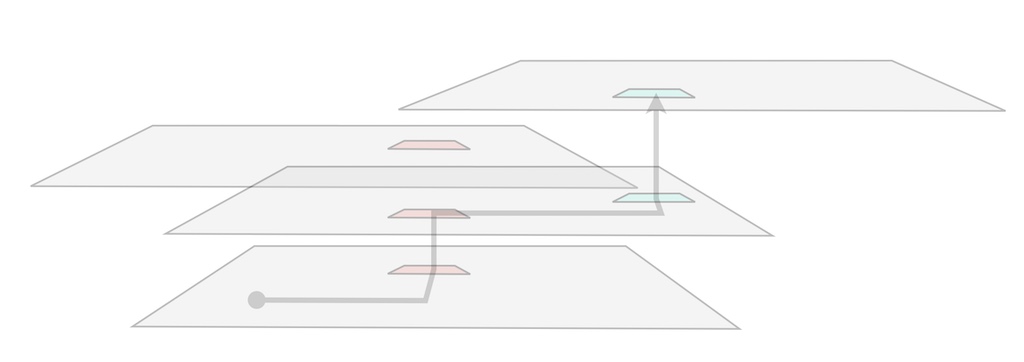
We imagine diagrams retrieved and aligned in 3d based on features they share. These provide portals through which attention and decorations can travel.
Home from Boston shows transit interchanges on a collection of maps at various scales.
We're assembling meaningful diagrams from an industrial setting and linking them together with a metadata editor.
digraph { node [shape=box style=filled] rankdir=LR node [fillcolor=palegreen] base -> team -> diagram -> metadata node [fillcolor=pink] metadata -> thing -> dot thing -> description node [fillcolor=palegreen] base -> index index -> team [label=search] index -> diagram [label=search] index -> thing node [fillcolor=bisque] diagram -> indexer indexer -> index [label=upload] metadata -> indexer base -> editor editor -> metadata [label=download] }
Here we share a preview of our tooling with the hope of sector-wide collaboration. Chrome specific for now.
pages/diagrams-as-base-model
pages/diagrams-as-base-model/data/seran-outpost
{ "things": { "Thing One": { "type": "any", "dot": [300,300], "description": "From The Cat in the Hat book." }, "Thing Two": { "type": "any", "dot": [500,300] } } }
For variety we grab diagrams from wiki sites.
New Pattern Langue for Growing Regions.
The Dayton Method now as Designed Ingenuity.